Releases
CloverDX 5.8 focuses on the Operations aspect of using CloverDX. We're introducing the Operations Dashboard that helps you to quickly see the health of your business processes. The Operations Dashboard is the new landing page of Server Console to bring focus to the oversight of your data processing. On the backend, the dashboard communicates with the Server via a new REST API. This new Monitoring API is public and allows you to create your own dashboard integrations.
New features in 5.8
Operations Dashboard
The Operations Dashboard offers a quick way of seeing status and health of your business processes. The Dashboard displays tiles called Monitors with each Monitor showing health of processes according to your own configuration. Each Monitor can track any number of job automation triggers – Data Services and Data Apps, Scheduler, Event Listeners – and provides summary of their health.
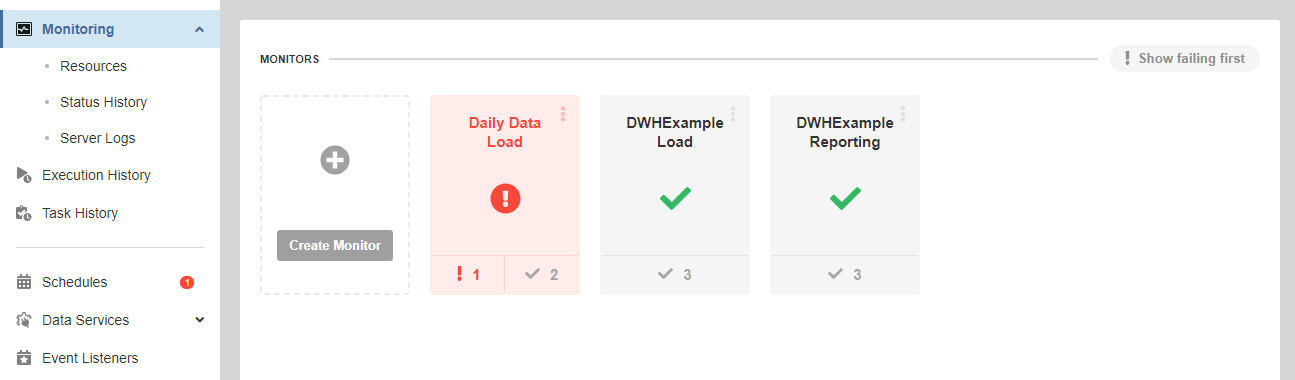
Monitors provide a way to quickly see an issue and drill-down to its root cause for quick problem resolution. After reviewing the issues, each trigger can be marked as resolved to ensure that other team member do not investigate the same problem.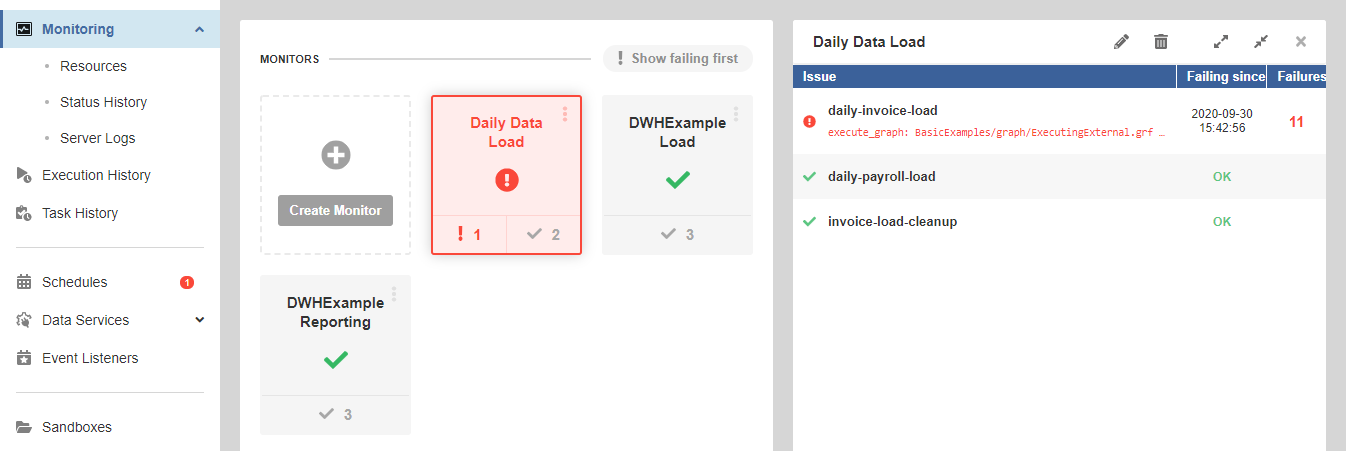
We’ve also implemented a new log file that allows you to track historical changes of your Monitors. This log is part of CloverDX Server support package so you can easily export and send it to our CloverCARE team for assistance.
Monitoring REST API
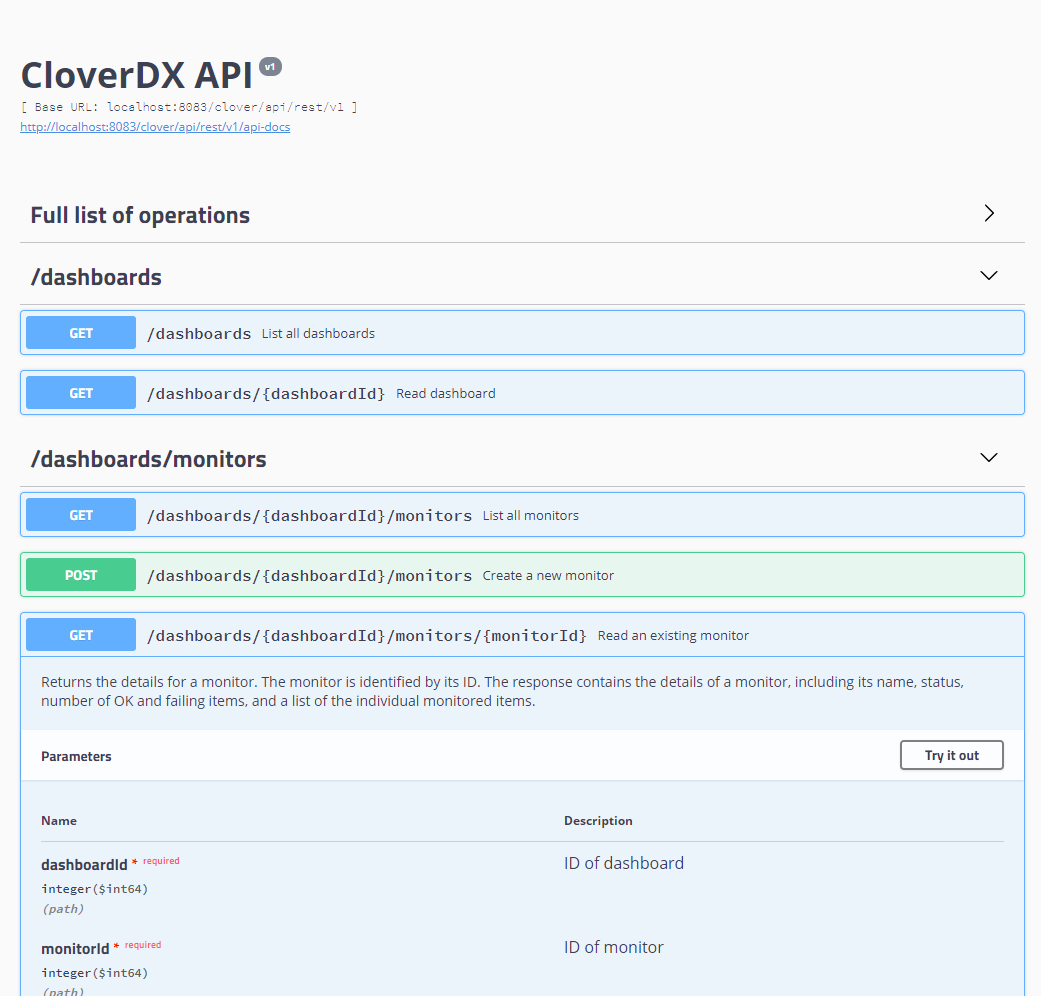
The Operations Dashboard is backed by a modern REST API. The Monitoring REST API is public and you can use it to create custom dashboards or integrate 3rd party monitoring solutions with CloverDX.
CloverDX Server provides a complete and easy to use documentation of the REST API. You can use the documentation pages to test the API and see the responses it provides.
Alerts and Notifications
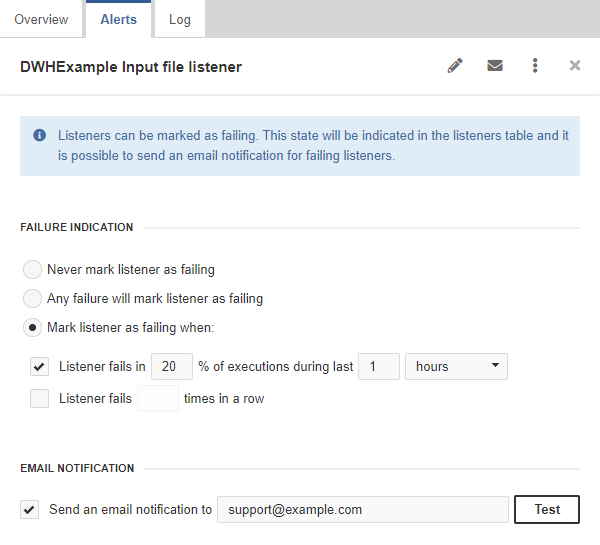
All of CloverDX Server's automation triggers (Data Services, Schedules and Event Listeners) now provide the same capabilities for error reporting and notifications. For example, you can specify that an Event Listener is considered as failing if it encounters an error in 10% of its executions in the last hour.
These new options provide you with robust and easy to use ways of keeping track of your CloverDX Server and allow you to monitor your processes even without having to actively look into Server Console.
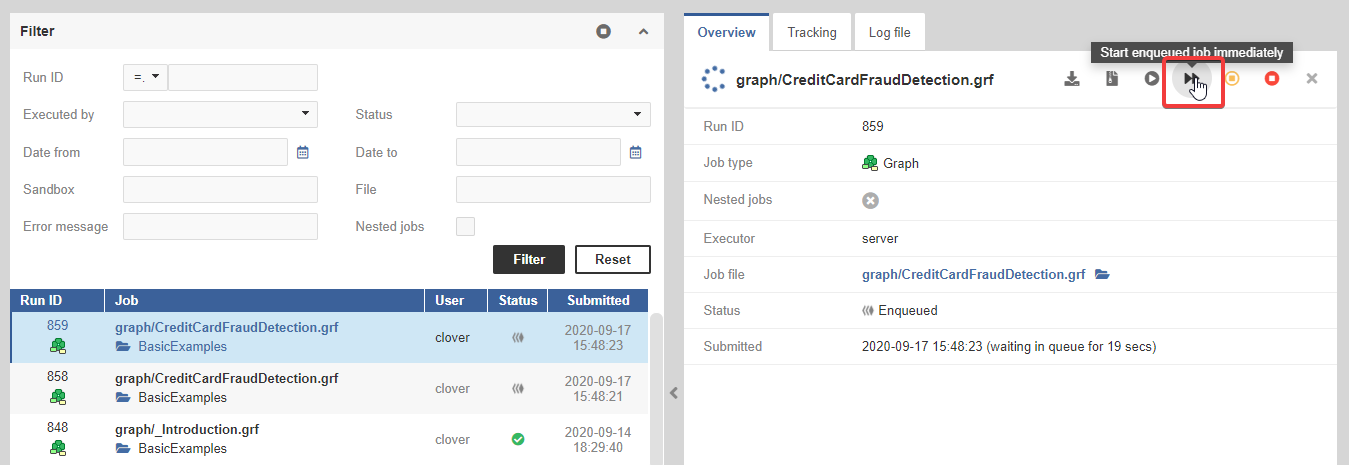
Job Queue Improvements
If an important job is enqueued for a long time and you need it to start now, you can use the Start Enqueued Job Immediately action. With this action you manually force an enqueued job to start immediately.
To help you install or upgrade to this version, we've prepared a simple checklist:
Before You Upgrade
- Be sure to check the "Compatibility" notes for ALL intermediary releases. We mark all changes that can potentially alter the function of your existing transformations with a "Compatibility" label. Typically, you can safely ignore most of them, as we try hard to keep as much backwards compatibility as possible. There's a comprehensive list of all releases that will help you get the information quickly.
- Upgrade Designer and Server together. We always release Designer and Server together under a single version. It's highly recommended to upgrade Server and all Designers at the same time. Although using different versions of Designer to connect to Server might work, it is not generally supported.
- There are no incremental patches. We don't release incremental patches. Every upgrade is in fact a full installation that, if installed over the older version, will automatically update whatever is necessary in your workspaces, sandboxes, and Server databases as needed, no user data will get overwritten.
- Don't forget to backup. Although none of the above upgrade steps requires explicit backup, we recommend you always back up your work. The upgrade will keep all your transformations, jobflows, and configurations safe. However, as a good word of advice, it never hurts to have a backup.
Designer Upgrade
- Download the latest version by logging into your customer account. If you lost your credentials or no longer have access there, click here to recover your password or contact our CloverCARE Support.
- Install the new version of Designer. You can install Designer over your existing installation. The process will automatically clean up the old version. Don't worry, you will NOT lose your workspaces, graphs, and transformations. However, if you installed some additional plugins to Designer (Eclipse plugins) you might need to reinstall them. Eclipse should automatically help you do that. When you start the application, point it to your existing workspace directory. With some major releases, we may notify you about upgrading the workspace to the latest version. In such cases, you won't be able to use the workspace with previous versions—be sure to upgrade ALL Designers at once if you're sharing the workspace.
- Activate the product on first start. You will need a new key as we issue new license keys for every new major version (e.g. from 4.9 to 5.0). If you're on our maintenance program, we automatically renew the keys for you. Just go to the License Keys again and copy/paste the license keys from there. If you can't find the latest keys, please contact us to renew your product maintenance.
Server Upgrade
- Download the latest version by logging into your customer account. You'll find Server in the same list as Designer downloads. If you no longer have access there, click here to recover your password or contact our CloverCARE Support.
- Plan for downtime. Upgrading Server requires downtime, so plan your upgrades in advance. If you're running multiple environments, upgrade the non-production installation first and run all your tests there first.
- Follow our step-by-step Server Upgrade Guide. We've prepared detailed instructions on how to properly shut down Server and install a new one. Server will upgrade its database and sandboxes from any previous version automatically.
- Activate the product on the login screen of Server Console. Server requires new license keys with every major version (e.g. from 4.9 to 5.0) and we automatically renew the keys for you. Just go to the License Keys again and copy/paste the license key from there.
| Release | Compatibility/Upgrade notes, Features & Fixes | Published | Download | ||||||||||||||||||||||||||||||||||||||||||||||||||||||||||||||||||||||||||||||
|---|---|---|---|---|---|---|---|---|---|---|---|---|---|---|---|---|---|---|---|---|---|---|---|---|---|---|---|---|---|---|---|---|---|---|---|---|---|---|---|---|---|---|---|---|---|---|---|---|---|---|---|---|---|---|---|---|---|---|---|---|---|---|---|---|---|---|---|---|---|---|---|---|---|---|---|---|---|---|---|---|---|
|
|
August 24, 2021 | Documentation Download CloverDX 5.8 5.8.3 | |||||||||||||||||||||||||||||||||||||||||||||||||||||||||||||||||||||||||||||||
Platform Updates & Security
|
April 08, 2021 | Documentation Download CloverDX 5.8 5.8.2 | |||||||||||||||||||||||||||||||||||||||||||||||||||||||||||||||||||||||||||||||
Features & Improvements
Fixes
|
October 27, 2020 | Documentation Download CloverDX 5.8 5.8.1 | |||||||||||||||||||||||||||||||||||||||||||||||||||||||||||||||||||||||||||||||
Operations Dashboard
REST API
Additional Improvements
Fixes
|
October 13, 2020 | Documentation Download CloverDX 5.8 5.8.0 | |||||||||||||||||||||||||||||||||||||||||||||||||||||||||||||||||||||||||||||||
- For Developers (Improvements most useful for developers bringing new functionality or optimizations in data transformation and orchestration)
- For Administrators (Improvements or features that will help setup, install, administer and manage the platform)
- For Support (Helps staff supporting the production environment to identify and escalate potential problems or avoid such)
- For Security (Improvements and changes relevant to security focused staff – sys admins and developers alike)